NB. These methods were developed for use with pre-existing mounted quantitative samples and the study of latitudinal variation in body-size.
Selection of species for analysis:
- The species should have a wide latitudinal distribution, at least 10 degrees of latitude.
- The species should be sufficiently abundant in at least three sites across its range.
- Sufficiently abundant is defined as minimum of 10 adult individuals. However, ideally there should be 20 adult individuals 10 male and 10 female allowing differences between the sexes to be examined.
Possible practical problems when reviewing the quantitative samples that may prevent sufficient measurements being obtained:
- The majority of the individuals present are juveniles. Both males and females can typically be distinguished by the presence of developed copulatory structures, spicules in the male, vulva in the female, and the presence of gonads.
- Individuals are too distorted by the formalin to make measurement practical. Some species coil tightly in reaction to the formalin, this makes it difficult to trace the path of the body and to determine the positions of the copulatory structures, anus, and oesophagus.
- Poor orientation. Occasionally the body of the nematode is in part orientated vertically making accurate measurements impossible.
- Part of the body is obscured. In compliance with Murphy’s Law, part of the body of the individual is obscured by another organism, organic material or a grain of sand.
The problems described above indicate why in many cases, despite a species being abundant with a wide distribution, it proves difficult to acquire sufficient measurements for valid statistical analyses.
Measurement methods:
Measurements can be obtained using a drawing tube attached to a compound microscope. These drawings should be made at the highest magnification possible where the complete specimen remains with in the field of view. In extreme cases where the nematode is very long and thin, measurements of the width will need to be made at a higher magnification than that used to measure the length. Drawings are preferable to photographs due to the shallow depth of field of the image. The focus can be adjusted continuously during the drawing process ensuring and accurate representation of the specimen. New developments in image manipulation mean that it might be possible to achieved the same effect by combining multiple photos, effectively multiple transects through the specimen, but this is clearly far more time consuming and I’ve no idea if it would be effective.
- The length of the body of the selected individual is traced with the aid of a drawing tube.
- The maximum body width is traced.
- The position of the anus is marked.
- The position of the posterior end of the oesophagus is marked
- The position of the spicula in males is marked (same location as the anus).
- The position of the vulva in females is marked.
- The drawing is given an identifying number and the sex is indicated.
- Measurements can then be made, with reference to a calibrated scale, using either a map-measurer or by scanning the drawings and using software.
- De Man ratios are calculated along with %V.
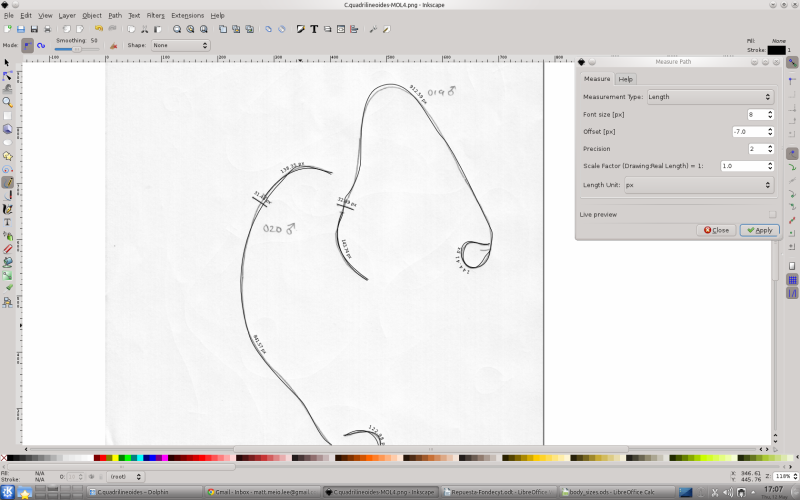
Analysis using Inkscape (Open source – Linux/Windows/Mac):
- Open the scanned drawing in inkscape.
- Zoom in to around 100% or more, depending on the size of the nematode.
- Select “Draw freehand lines” (F6) from left hand side toolbox.
- Set Smoothing to 50% (top-left).
- Select the Measure Path extension (Extensions>Visualize Path>Measure Path).
- Use the following settings: Measurement Type = Length, Font size = 8, Offset = -7.0, Precision = 2, Scale factor = 1, Length unit = px.
- These settings are the ones I use as ‘default’ but can be adjusted as necessary, e.g. make the font size smaller for short lines so the display of the measurement is not cut off.
- Trace over the lines using the cursor. This can be done with a mouse but is easier with a graphics tablet. If the traced line strays too far from the original do it again!
- Press “Apply” in the Measure Path dialogue, and the measurement in px (pixels) will be placed adjacent to the line.
- Before moving on to the next measurement ensure that it is legible, the figures are mapped to the curve of the line, if the figures are squeezed on the inside of a curve try tracing the line from the opposite end so the figures are on the outside of the curve. Changing the font size may also help. Setting smoothing to 50% also helps ensure that the figures are legible.
- Calibration can be achieved using drawings of a stage micrometer under the same magnifications.
- Save the file as an SVG for later analysis.