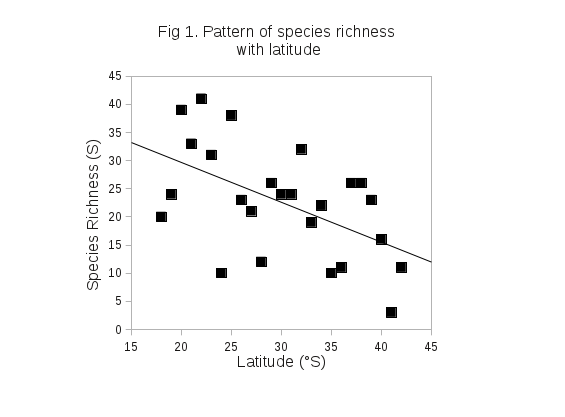
In total 330 50 ml quantitative samples from 66 exposed beaches between 18 and 42 °S were analysed. The species richness of the exposed sandy beach nematode assemblage declined with increasing latitude (Fig. 1). Pearson’s correlation (-0.582, p = 0.005) and ‘ordinary least squares’ regression analysis (R2 = 0.160, p < 0.001) indicated that this relationship was significant. In order to ensure that the observed pattern was not an artifact of the month in which sampling took place a variable S.Time was created with a scale of 1 to 12, with summer months assigned low values and winter months high values. Pearson’s correlation (0.022, p = 0.916) indicated that the observed pattern was not a product of the month in which sampling took place. The species richness varied between 1 and 22 species per site, or between 3 (41 °S) and 41 (22 °S) species per degree of latitude between 18 and 42 °S. In total 158 species of nematodes were identified, within 99 genera and 32 families. The families with widest distributions were Thoracostomopsidae, Oncholaimidae, Chromadoridae, Desmadoridae, Microlaimidae, Xyalidae and Axonolaimidae. The species with the widest distributions were Enoplolaimus connexus, Nygmatonchus fossiferus, Onyx septimpapillatus, Microlaimus sensus, Omicronema litorium, Promonhysteria tricuspidata, Rhynchonema cincitium, Theristus modicus, Theristus problematicus and Odontophora peritricha. An estimation of the potential species richness using the Chao2 method predicted a true species richness of 246 species, with a confidence interval of 29 species.
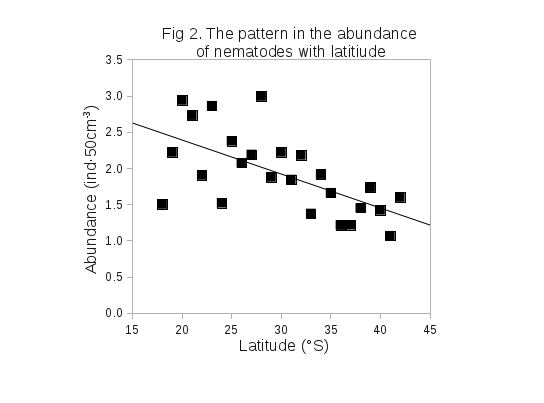
The abundance of the nematode species assemblage present in exposed sandy beaches between 18 and 42 °S also declined with increasing latitude (Fig. 2). The abundance data was log transformed (Log(N)). Pearson’s correlation (-0.632, p < 0.001) and ‘ordinary least squares’ regression analysis (R2 = 0.390, p < 0.001) indicted that this pattern was statistically significant. The Pearson’s correlation with S.Time (0.088, p = 0.688) again indicated that the observed pattern was not a result of the month in which the samples were collected. The mean abundance of nematodes per site varied between 3 and 1789 ind·50 cm-3, or per degree of latitude between 11.6 (41 °S) and 986.2 (28 °S) ind·50 cm-3. The abundances of those species recorded in 10 or more sites were analysed using quartile regression analyses. The following species exhibited declines in abundance with increasing latitude at the 95th quartile O. peritricha, Halalaimus sp., Mononcholaimus seperablis, Oncholaimus flexus, Enoploides reductus and Euchromadora amokurae, as did the total abundance of nematodes. The following species exhibited declines in abundance with increasing latitude at the 90th quartile O. peritricha, O. septempapillatus, Epsilonema sp., M. seperablis, O. flexus, E. reductus, Chromadora quadrilineoides, E. amokurae, M. sensus and Theristus megalaimoides, and again so did the total nematode abundance. On the other hand, the following species exhibited increases in abundance with increasing latitude at the 90th quartile O. litoriumand Mesocanthion ungulatus.
The following measures of diversity were calculated, Simpson’s index (1-λ), Pielou’s homogeneity (J’), and taxonomic distinctness (Δ). None of theses measures exhibited patterns of latitudinal variation suggesting that niche availability in exposed sandy beaches does not vary significantly with latitude.